Examples
Two example scripts.
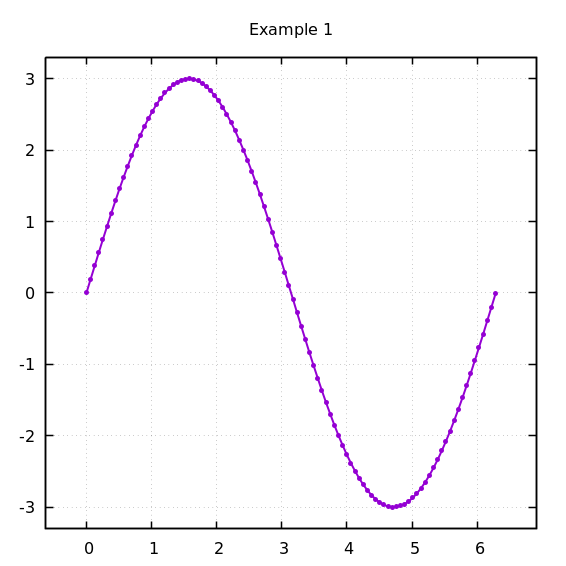
Example 1
Code
import numpy as np
import gnuplotpy as gp

amplitude = 3.
x = np.linspace(0., 2*3.14, 100)
y = amplitude*np.sin(x)

args = {
    'the_title': 'Example 1',
    'amp': amplitude,
    'x_max': x[-1],
    'filename': 'example1.png'
}
data = [x, y]
gp.gnuplot('example1.gpi', args, data)
set datafile separator ','
set term pngcairo size 20cm,20cm
set out filename

unset key
set grid
set border lw 1.5

set title the_title
set xrange [x_max-1.1*x_max:x_max*1.1]
set yrange [-1.1*amp:1.1*amp]

plot data u 1:2 w lp pt 7 ps 0.5 lw 2

set out
Output
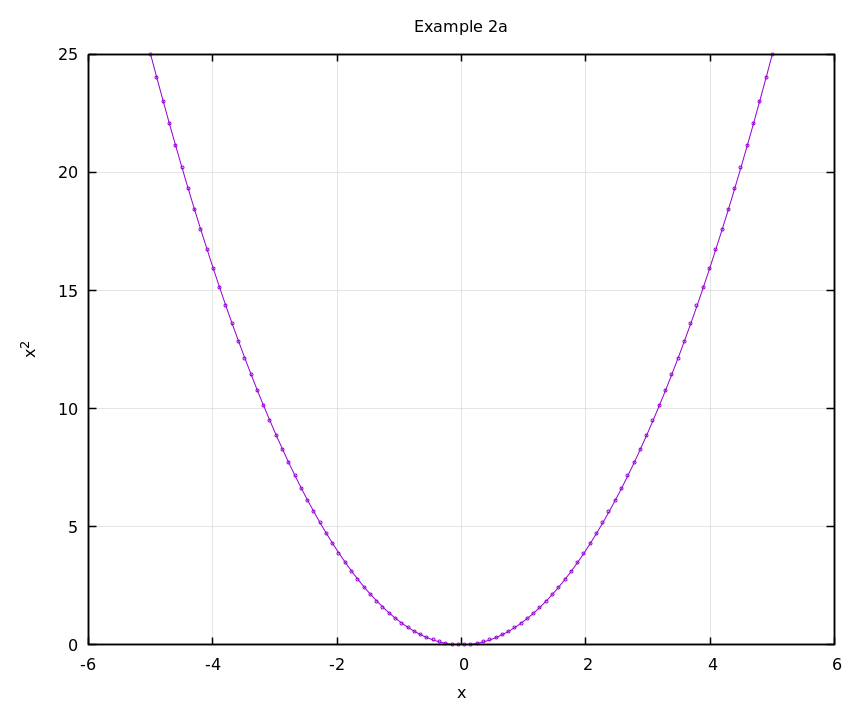
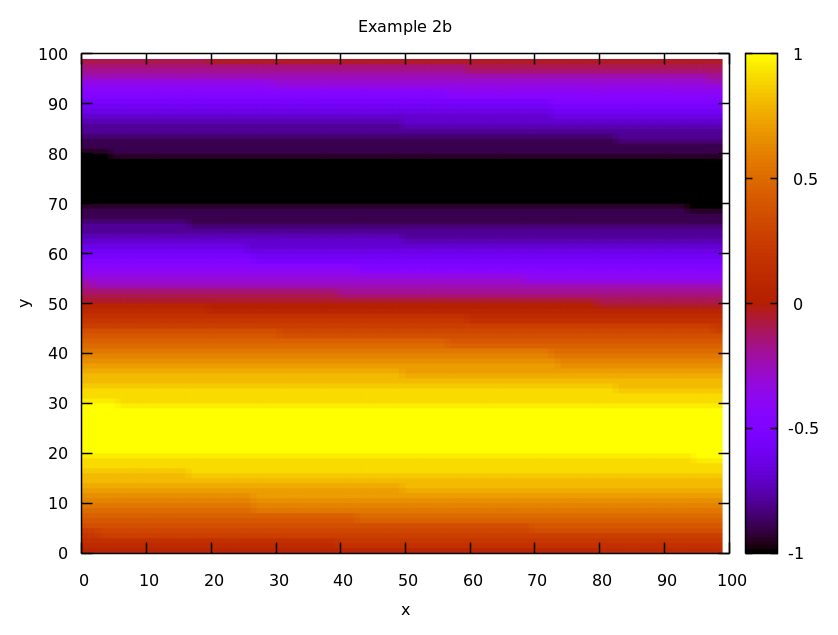
Example 2
Code
import numpy as np
import gnuplotpy as gp

x = np.linspace(-5, 5, 100)
y = x**2
gp.gnuplot_2d(x, y, 'example2a.png', 'Example 2a', 'x', 'x^2')

z = np.linspace(0., 2.*np.pi, 10000)
z = z.reshape(100, 100)
z = np.round(np.sin(z), 1)
gp.gnuplot_3d_matrix(z, 'example2b.png', 'Example 2b', 'x', 'y')